.png?width=190&height=122&name=Summit-Virtual-CFO_color_rgb%20(1).png "Summit-Virtual-CFO_color_rgb (1)")


Without a plan to evaluate your business performance from time to time, even the best laid plans can fall apart. If you don’t already have a plan, it’s time to create a scoreboard using quality metrics to give you the daily insight that you need to run your business successfully.
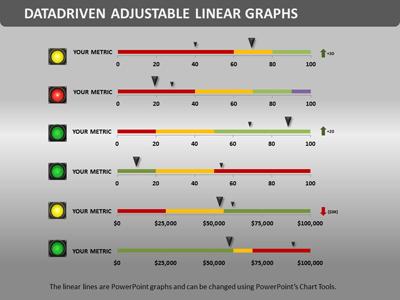
By creating an efficient scoreboard you can have a comprehensive view of your business in one report. Your report will provide a daily view of the health of your business that includes your key financial and non-financial metrics. To be effective your measures should be available on demand, brief, and include data that will enable you to spot trends and react appropriately. Below are 4 successful metrics for your consideration.
- Quick financial ratio. Combine your total accounts receivable, cash, and short term investments. Next, divide your total by your current liabilities to
 get a quick ratio. This is an easy way to see if you have sufficient funds on hand to pay your immediate bills. If you have a value of 1.0 or more, you should have sufficient assets to cover your short term debts. Any values less than 1.0 could mean that you rely too much on debt to fund your business or pay expenses.
 - Customer retention ratio. Start by creating a list of your customers that made a purchase in the current year and then make a list of customers that made a purchase in the previous year. Next, remove any new customers gained in the current year. Then, divide the total amount of customers from the previous year by the remaining amount customers in the current year. This will give you the percentage of your customer retention. You can measure this over time to find out if your company is retaining or losing your core customers. By viewing your calculations monthly you can see how your customer base builds over the year.
- Internal asset turnover ratio. Start by dividing your total sales by the average total assets on the company balance sheet (beginning assets + ending assets ÷ by 2, for the same period of time). This will tell you the amount of sales produced for each dollar dedicated to your assets. Reviewed over time you can better understand if the assets used to run your business have become more or less effective.
- Net income growth per employee. Begin by dividing your net income by the number of employees for a period of time. Theoretically, as your workforce grows it should also generate more income per employee. Be sure to account for your part-time employees before making your calculations. If for some reason your income per employee is decreasing over time you need to figure out why. For example: Maybe you have a high rate of employee turnover or perhaps there is an area may benefit from more training.
These ratios will help you analyze the different aspects of your company but will not tell the whole story. It may take some time to find the right metrics for your scoreboard but the result is valuable and can take your company to the next level.
At Summit CPA we offer multiple resources to assist you in growing your business. Are you ready to get an edge on your competitors? Contact our office at (866) 497-9761 to schedule an appointment with our advisors.


Leave a comment